- Initial use case
- DevOps metrics comparison
- View the value streams dashboard
- Customize the dashboard panels
- Dashboard metrics and drill-down reports
Value Streams Dashboard (Beta)
- Introduced in GitLab 15.8 as a Closed Beta feature with a flag named
group_analytics_dashboards_page. Disabled by default. - Released in GitLab 15.11 as an Open Beta feature with a flag named
group_analytics_dashboards_page. Enabled by default. -
Generally available in GitLab 16.0. Feature flag
group_analytics_dashboards_pageremoved.
You can leave feedback on dashboard bugs or functionality in issue 381787.
The Value Streams Dashboard is a customizable dashboard that enables decision-makers to identify trends, patterns, and opportunities for digital transformation improvements. This page is a work in progress, and we’re updating the information as we add more features. For more information, see the Value Stream Management category direction page.
Initial use case
Our initial use case is focused on providing the ability to compare software delivery metrics. This comparison can help decision-makers understand whether projects and groups are improving.
The beta version of the Value Streams Dashboard includes the following metrics:
The Value Streams Dashboard allows you to:
- Aggregate data records from different APIs.
- Track software performance (DORA) and flow of value (VSA) across the organization.
DevOps metrics comparison
The DevOps metrics comparison displays DORA4 and flow metrics for a group or project in the month-to-date, last month, the month before, and the past 180 days.
This visualization helps you get a high-level custom view over multiple DevOps metrics and understand whether they’re improving month over month. You can compare the performance between groups, projects, and teams at a glance. This visualization helps you identify the teams and projects that are the largest value contributors, overperforming, or underperforming.
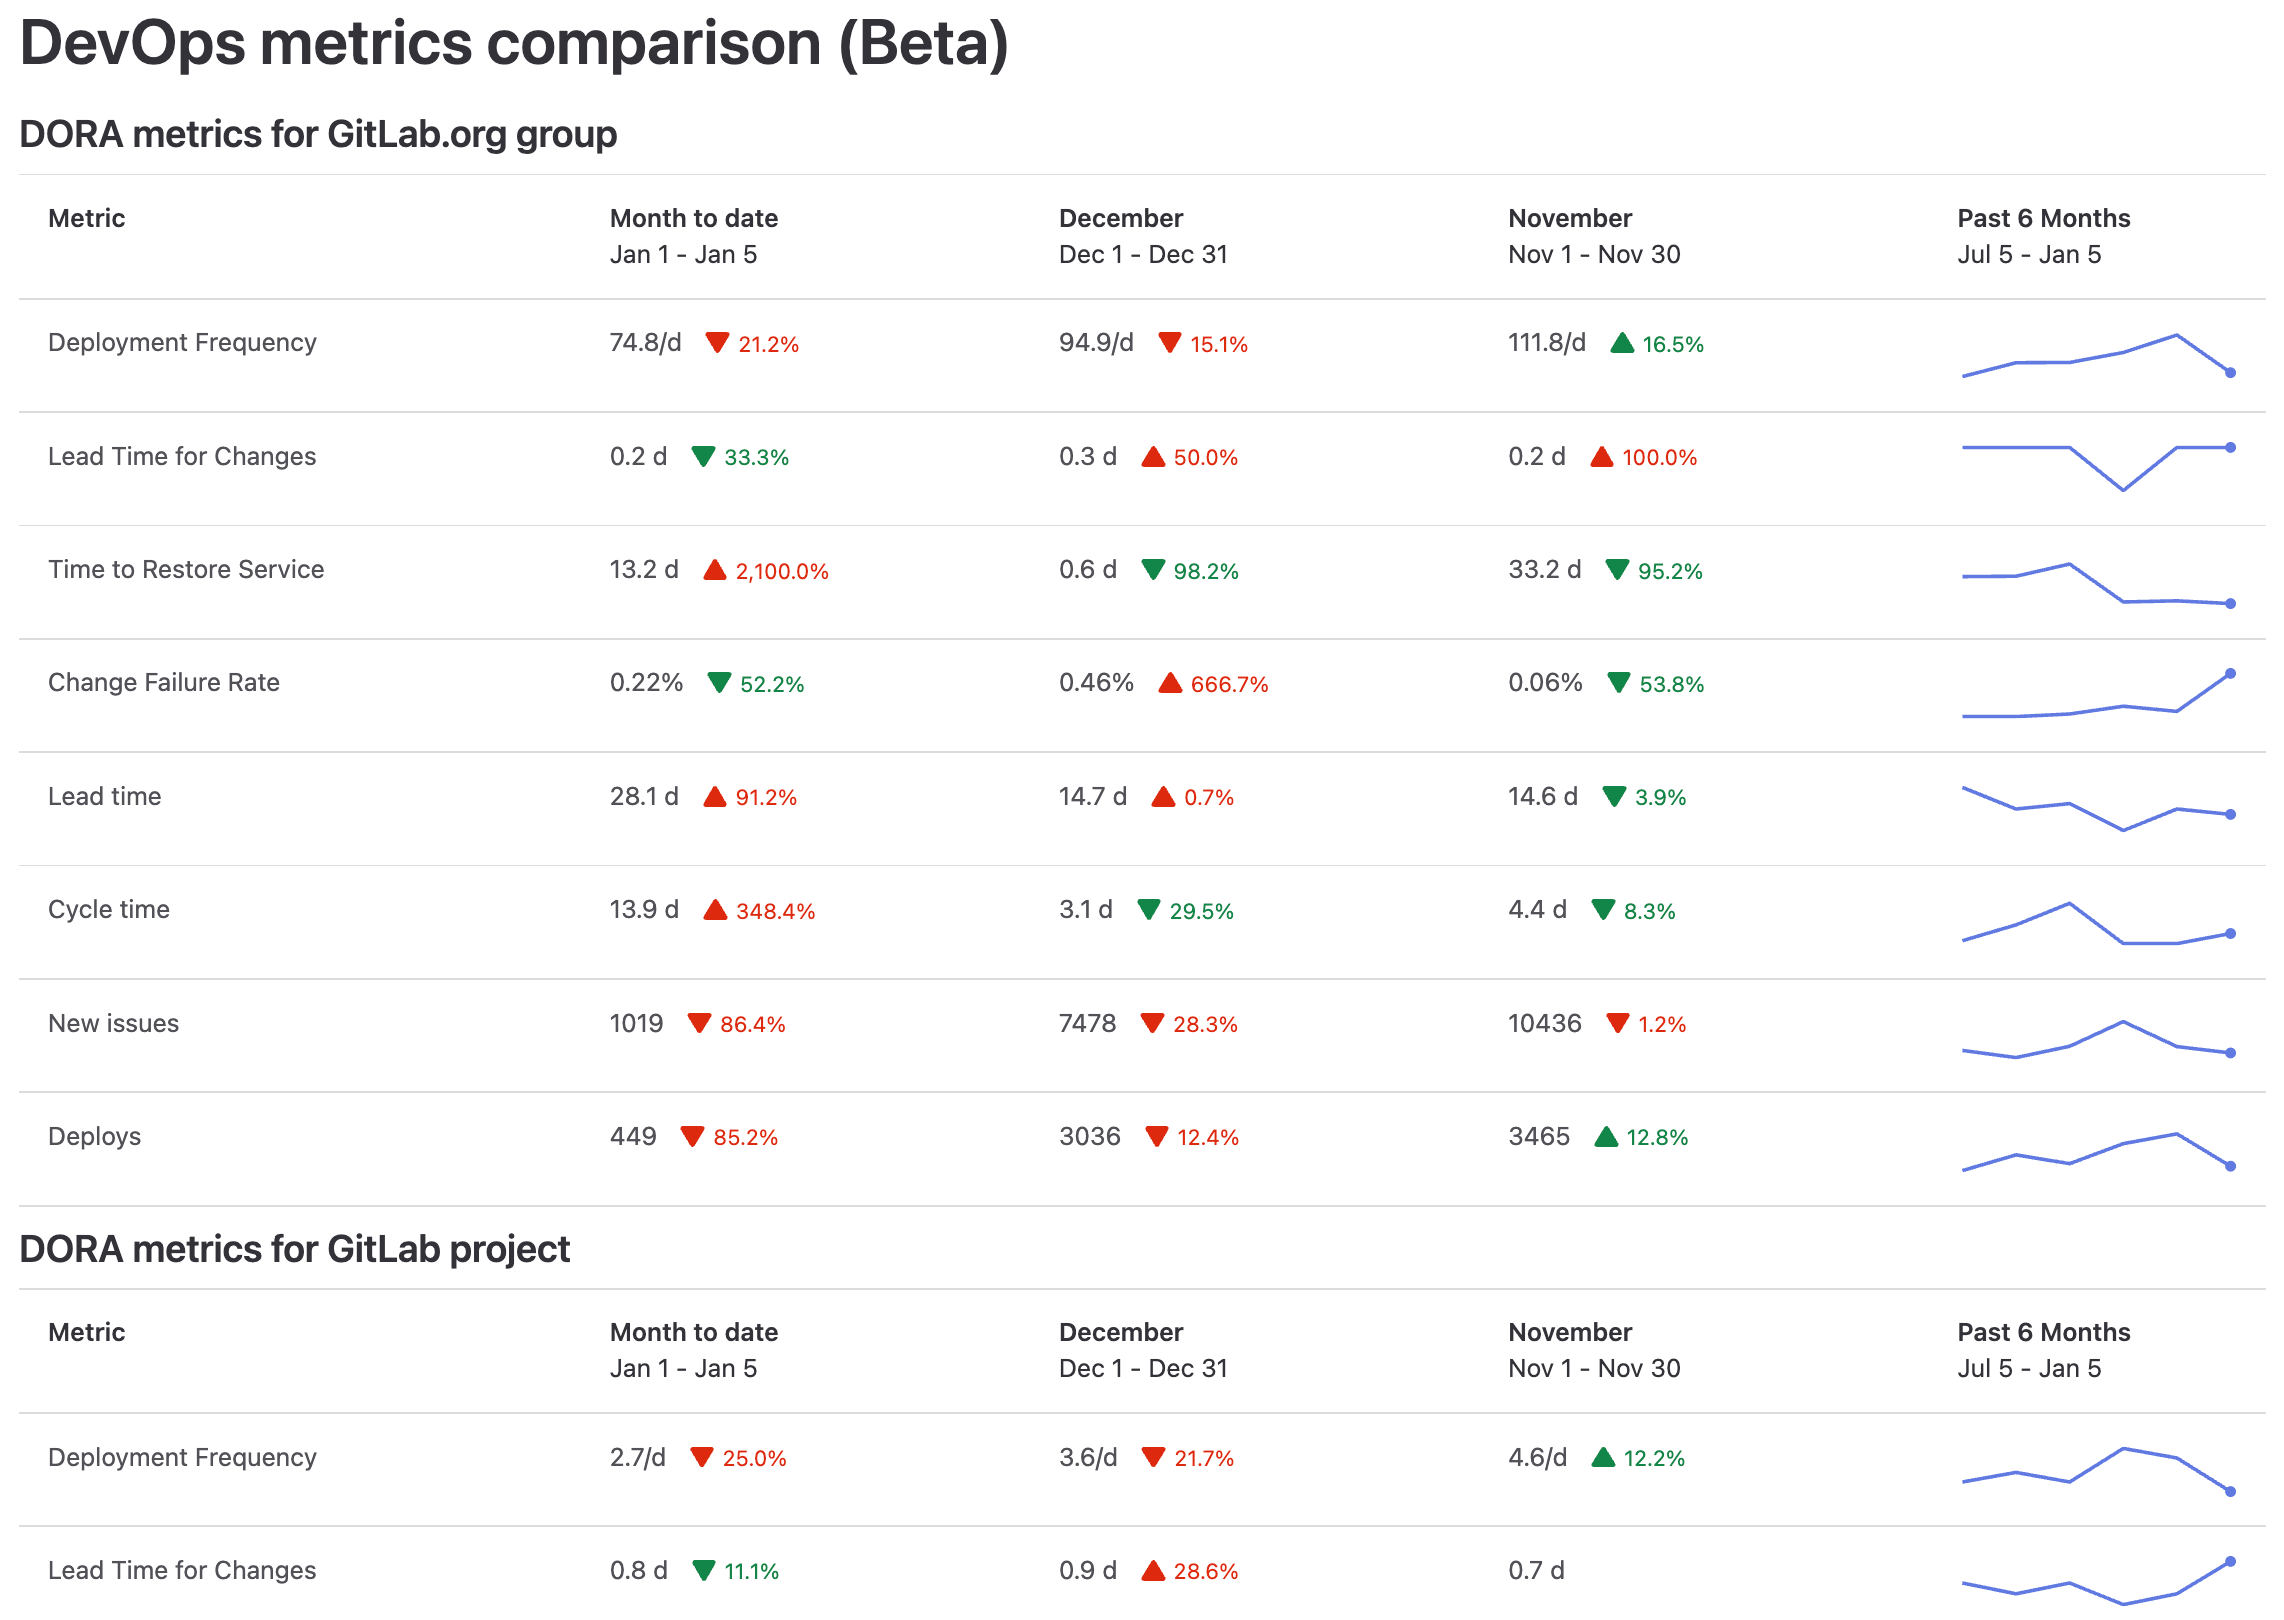
You can also drill down the metrics for further analysis. When you hover over a metric, a tooltip displays an explanation of the metric and a link to the related documentation page.
View the value streams dashboard
Prerequisite:
- To view the value streams dashboard for a group, you must have at least the Reporter role for the group.
To view the value streams dashboard:
- On the top bar, select Main menu, and:
- For a project, select Projects and find your project.
- For a group, select Groups and find your group.
- On the left sidebar, select Analytics > Value stream.
- Below the Filter results text box, in the Key metrics row, select Value Streams Dashboard / DORA.
- Optional. To open the new page, append this path
/analytics/dashboards/value_streams_dashboardto the group URL (for example,https://gitlab.com/groups/gitlab-org/-/analytics/dashboards/value_streams_dashboard).
Customize the dashboard panels
You can customize the Value Streams Dashboard and configure what subgroups and projects to include in the page.
A view can display maximum four subgroups or projects.
Using query parameters
To display multiple subgroups and projects, specify their path as a URL parameter.
For example, the parameter query=gitlab-org/gitlab-ui,gitlab-org/plan-stage displays three separate panels, one each for the:
-
gitlab-orggroup -
gitlab-uiproject -
gitlab-org/plan-stagesubgroup
Using YAML configuration
To change the default content of the page, you need to create a YAML configuration file in a project of your choice. Query parameters can still be used to override the YAML configuration.
First, you need to set up the project.
Prerequisite:
- You must have at least the Maintainer role for the group.
- On the top bar, select Main menu > Groups and find your group.
- On the left sidebar, select Settings > General.
- Scroll to Analytics Dashboards and select Expand.
- Select the project where you would like to store your YAML configuration file.
- Select Save changes.
After you have set up the project, set up the configuration file:
- On the top bar, select Main menu > Projects and find your project.
- In the default branch, create the configuration file:
.gitlab/analytics/dashboards/value_streams/value_streams.yaml. - In the
value_streams.yamlconfiguration file, fill in the configuration options:
# title - Change the title of the Value Streams Dashboard. [optional]
title: 'Custom Dashboard title'

# description - Change the description of the Value Streams Dashboard. [optional]
description: 'Custom description'

# panels - List of panels that contain panel settings.
#   title - Change the title of the panel. [optional]
#   data.namespace - The Group or Project path to use for the chart panel.
panels:
  - title: 'My Custom Project'
    data:
      namespace: group/my-custom-project
  - data:
      namespace: group/another-project
  - title: 'My Custom Group'
    data:
      namespace: group/my-custom-group
  - data:
      namespace: group/another-group
The following example has an option configuration for a panel for the my-group namespace:
  panels:
    - data:
        namespace: my-group
Dashboard metrics and drill-down reports
| Metric | Description | Drill-down report | Documentation page |
|---|---|---|---|
| Deployment frequency | Average number of deployments to production per day. This metric measures how often value is delivered to end users. | Deployment frequency tab | Deployment frequency |
| Lead time for changes | The time to successfully deliver a commit into production. This metric reflects the efficiency of CI/CD pipelines. | Lead time tab | Lead time for changes |
| Time to restore service | The time it takes an organization to recover from a failure in production. | Time to restore service tab | Time to restore service |
| Change failure rate | Percentage of deployments that cause an incident in production. | Change failure rate tab | Change failure rate |
| Lead time | Median time from issue created to issue closed. | Value Stream Analytics | View the lead time and cycle time for issues |
| Cycle time | Median time from the earliest commit of a linked issue’s merge request to when that issue is closed. | VSA overview | View the lead time and cycle time for issues |
| New issues | Number of new issues created. | Issue Analytics | Issue analytics for projects and for groups |
| Number of deploys | Total number of deploys to production. | Merge Request Analytics | Merge request analytics |
| Critical vulnerabilities over time | Critical vulnerabilities over time in project or group | Vulnerability report | Vulnerability report |
| High vulnerabilities over time | High vulnerabilities over time in project or group | Vulnerability report | Vulnerability report |