Runner Fleet Dashboard
Offering: Self-managed
- Introduced in GitLab 16.6
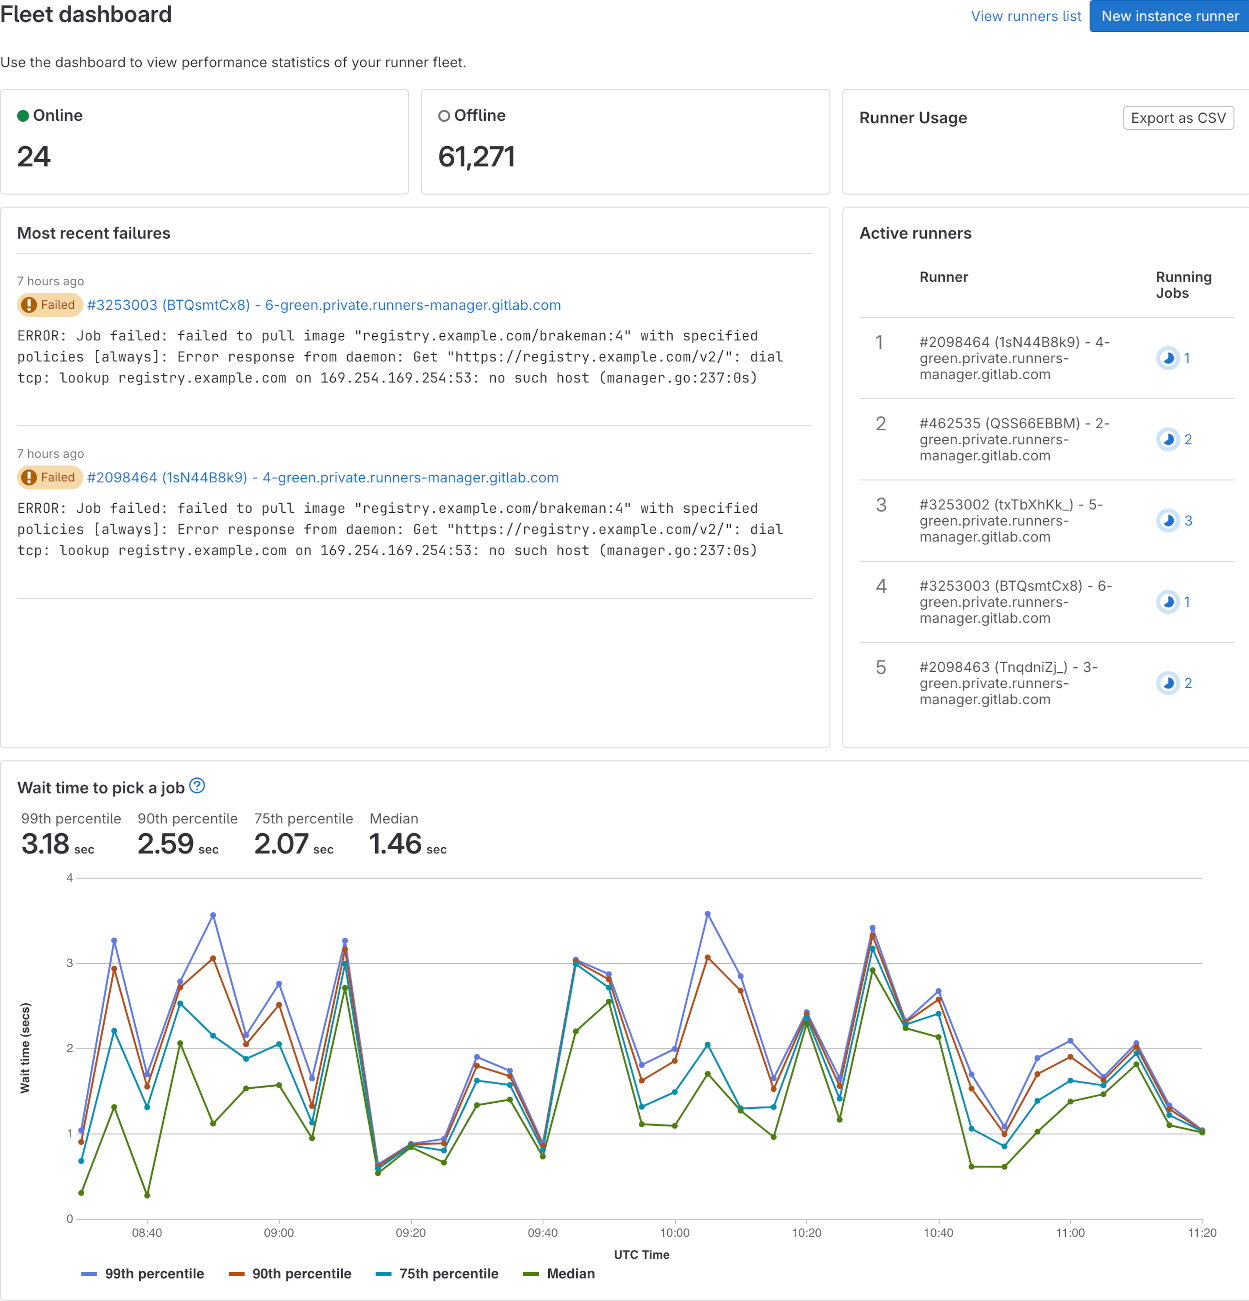
GitLab administrators can use the Runner Fleet Dashboard to assess the health of your instance runners. The Runner Fleet Dashboard shows:
- Recent CI errors related caused by runner infrastructure.
- Number of concurrent jobs executed on most busy runners.
- Histogram of job queue times (available only with ClickHouse).
Support for usage and cost analysis are proposed in epic 11183.
View the Runner Fleet Dashboard
Prerequisites:
- You must be an administrator.
To view the runner fleet dashboard:
- On the left sidebar, at the bottom, select Admin Area.
- Select Runners.
- Select Fleet dashboard.
Most of the dashboard works without any additional actions, with the exception of Wait time to pick a job chart and features proposed in epic 11183. These features require setting up an additional infrastructure.
Export compute minutes used by instance runners
Prerequisites:
- You must be an administrator.
To analyze runner usage, you can export a CSV file that contains the number of jobs and executed runner minutes. The CSV file shows the runner type and job status for each project. The CSV is sent to your email when the export is completed.
To export compute minutes used by instance runners:
- On the left sidebar, at the bottom, select Admin Area.
- Select Runners.
- Select Fleet dashboard.
- Select Export CSV.
Enable more CI analytics features with ClickHouse
Offering: SaaS, self-managed
Status: Experiment
-
Introduced in GitLab 16.7 with the flags named
ci_data_ingestion_to_click_houseandclickhouse_ci_analytics. Disabled by default. -
Enabled by default in GitLab 16.8. Feature flag
clickhouse_ci_analyticsremoved.
This feature is an Experiment. To test it, we have launched an early adopters program. To join the list of users testing this feature, see epic 11180.
Enable ClickHouse integration
To enable additional CI analytics features:
- Configure ClickHouse integration
-
Enable the following feature flags:
Feature flag name Purpose Status ci_data_ingestion_to_click_houseEnables synchronization of new finished CI builds to ClickHouse database. Enabled by default in GitLab 16.8. clickhouse_ci_analyticsEnables the Wait time to pick a job chart. Removed in 16.8.
For a video walkthrough, see Setting up Runner Fleet Dashboard with ClickHouse.
Feedback
To help us improve the Runner Fleet Dashboard, you can provide feedback in issue 421737. In particular:
- How easy or difficult it was to setup GitLab to make the dashboard work.
- How useful you found the dashboard.
- What other information you would like to see on that dashboard.
- Any other related thoughts and ideas.